
Why Digital Marketing Stats Matter in 2024
Welcome to the world of digital marketing in 2024 – a landscape that’s changed massively since I started in this field. Understanding ‘Digital Marketing Statistics 2024’ is key to navigating these changes. Think of this as your GPS in the world of digital marketing.
In my two decades in digital marketing, I’ve seen trends come and go. But one thing’s clear: data drives decisions. Now, with technologies like AI shaping the field, it’s more important than ever to stay ahead with the latest statistics. Here’s a fact that might surprise you: digital marketing isn’t just about selling products anymore. It’s about stories, experiences, and connections. This guide is designed to delve into these aspects, backed by the latest stats and trends.
Let’s embark on this journey together, exploring the vital stats that will define digital marketing in 2024. We’ll look at how these interesting digital marketing statistics to help us better understand our audience and shape strategies that resonate.
Digital Marketing Industry Overview
The demand for digital marketing this year is like nothing we’ve ever seen. It’s not just about businesses wanting to sell online; it’s about building relationships. With more consumers online than ever, businesses are turning to digital channels to engage with their audience, tell their story, and build lasting connections.
Digital Marketing Success and ROI Statistics
Let’s talk numbers, the real MVPs of our story. The ROI (Return on Investment) from digital marketing can be staggering. For instance, email marketing, a veteran in this space, still offers an impressive average ROI of $42 for every $1 spent. And SEO? It’s the gift that keeps on giving, with top-ranking pages consistently drawing organic traffic, leading to higher conversion rates.
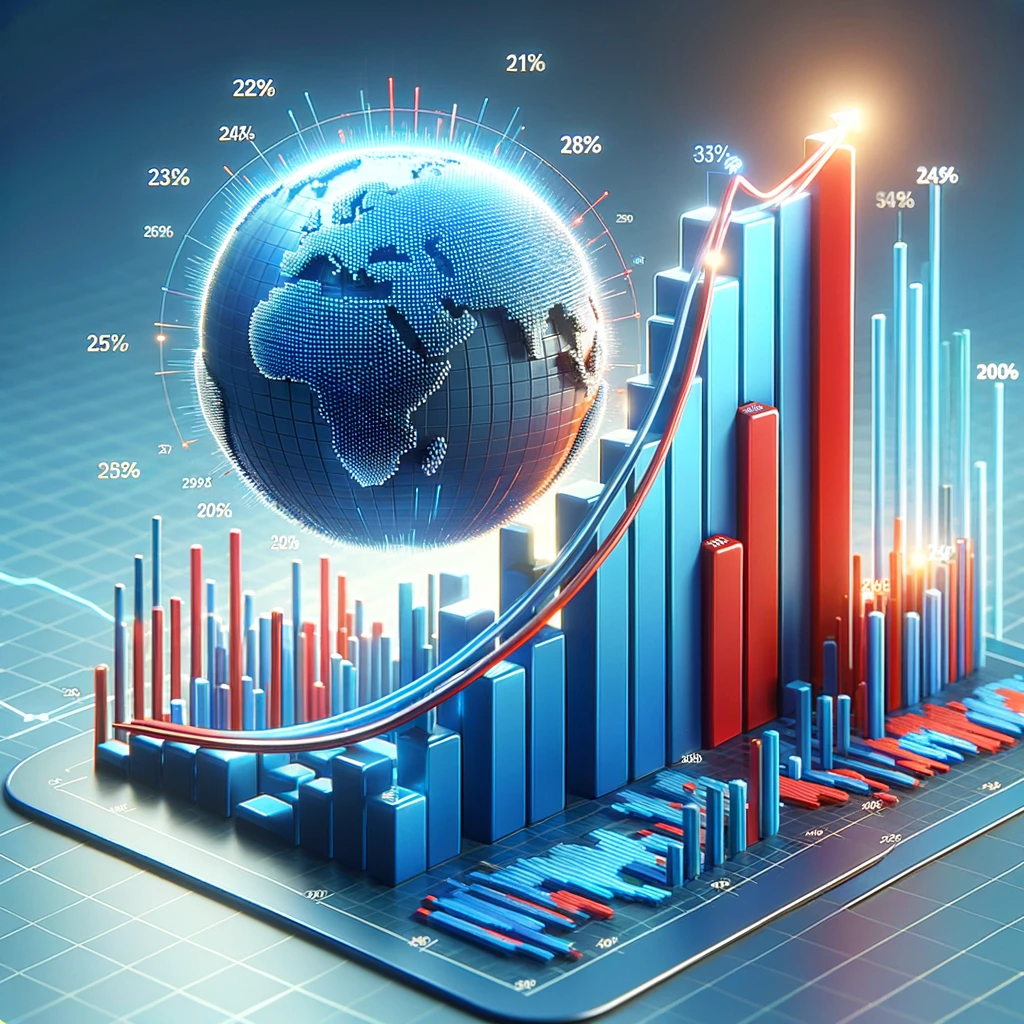
Here are two charts that showcases the Global Digital Marketing Size and Growth:
 3D curve line graph showing growth from $350 billion in 2020 to $786.2 billion by 2026.
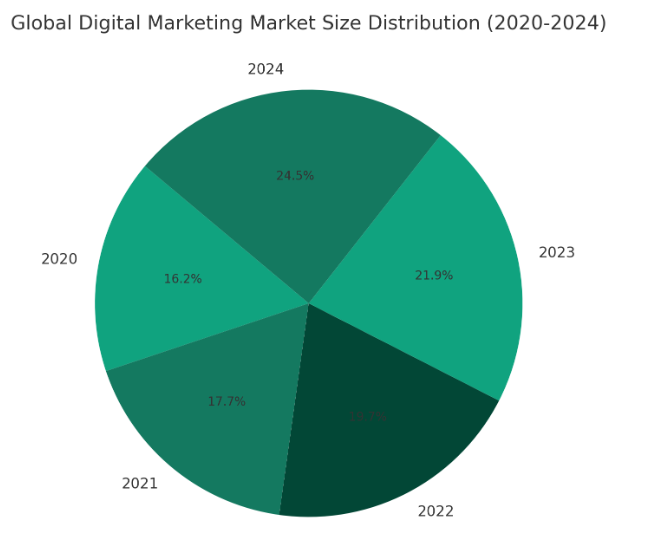 chart showcases the Global Digital Marketing Size from 2020 to 2024
Most Interesting Digital Marketing Industry Statistics
Digital marketing in 2024 isn’t just growing; it’s skyrocketing. When I started in the early 2000s, digital marketing was like a small sapling, now it’s a mighty oak. We’re witnessing an unprecedented growth rate. In fact, recent reports suggest that the global digital marketing market size is expected to expand significantly by the end of 2024.
But let’s not forget about emerging tools. AI-driven marketing platforms are reshaping how we approach digital strategies. A product that’s caught my eye is SEMrush’s AI Marketing Toolkit. It’s like having a digital marketing oracle, offering insights that help fine-tune strategies for better engagement and ROI. And the best part? They offer a free trial, giving you a taste of the future without any commitment.
The demand for digital marketing this year is like nothing we’ve ever seen. It’s not just about businesses wanting to sell online; it’s about building relationships. With more consumers online than ever, businesses are turning to digital channels to engage with their audience, tell their story, and build lasting connections.
Let’s talk numbers, the real MVPs of our story. The ROI (Return on Investment) from digital marketing can be staggering. For instance, email marketing, a veteran in this space, still offers an impressive average ROI of $42 for every $1 spent. And SEO? It’s the gift that keeps on giving, with top-ranking pages consistently drawing organic traffic, leading to higher conversion rates.
Now Let’s explore the digital marketing facts and stats list:
Market Size and Projections
These statistics provide insights into the size, digital marketing growth, and trends in the digital marketing industry, reflecting the importance of digital channels in the overall marketing landscape.
- Global Digital Advertising and Marketing Market Estimates (2020-2026)
- Estimated at $350 billion in 2020.
- Projected to reach $786.2 billion by 2026.
- Source: PR Newswire
- U.S. Digital Advertising and Marketing Market Size
- Currently estimated at $460 billion.
- Source: PR Newswire
- Compound Annual Growth Rate of Digital Marketing (2020-2026)
- Projected at 9%.
- Source: PR Newswire
- Growth Projections for Digital Display and Search Marketing
- Digital display projected to grow at a 15.5% CAGR.
- Search marketing projected to grow at 12.2% CAGR.
- Source: LocaliQ
- Increase in Digital Marketing Budgets
- 63% of businesses increased digital marketing budgets in the past year.
- Source: LocaliQ
- Growth Rate in Digital Marketing Budget Spending (2020-2021)
- 14% growth rate in digital marketing budget spending.
- Source: LocaliQ
- Success Rate of Digital Marketing
- PPC returns $2 for every $1 spent (200% ROI).
- Highest ROI reported from Facebook Ads and Google Ads.
- Organic search brings the best marketing ROI for 49% of businesses.
- Source: Google Economic Impact, HubSpot, Backlinko, Constant Contact
- Percentage of Marketing That is Digital
- 72% of overall marketing budgets are allocated to digital channels.
- 55% of marketing is digital, with global digital ad spend in 2021 being $436 billion.
- Source: Web Strategies Inc, Marketing Charts
- Digital Marketing Demand in 2024
- Marketing job demand set to increase by 10% by 2026.
- Customer marketing managers and search marketing managers are among the fastest-growing jobs.
- Source: Wordstream, ZipRecruiter, CNBC
Growth Rate of Digital Marketing
These statistics show just how important the growth trends within the digital marketing industry, indicating significant expansion in terms of both market size and investment in digital marketing strategies.
- Compound Annual Growth Rate (CAGR) Projection (2020-2026)
- The compound annual growth rate of digital marketing from 2020-2026 is projected at 9%.
- Source: PR Newswire
- Growth Projections for Digital Display and Search
- Digital display is projected to grow at a 15.5% CAGR.
- Search marketing is projected to grow at a 12.2% CAGR.
- Search accounts for 40.9% of the global digital advertising and marketing market.
- Source: LocaliQ
- Increase in Digital Marketing Budgets
- 63% of businesses have increased their digital marketing budgets in the past year.
- Source: LocaliQ
- Growth Rate in Digital Marketing Budget Spending (2020-2021)
- There was a 14% growth rate in digital marketing budget spending across businesses between 2020 and 2021.
- Source: LocaliQ
Digital Marketing Budgets
These statistics highlight various aspects of digital marketing budgets, including the significant impact of online reviews on consumer decisions, Google’s dominance in the search engine market, consumer shopping behaviors, and the adoption of marketing attribution and CRM tools by businesses.
- Impact of Online Reviews on Consumer Behavior
- 93% of people read online reviews before making a purchase.
- Source: LocaliQ on Online Review Stats
- Consumer Interaction with Bad Reviews
- Consumers can spend up to 5 times longer on a site once they’ve interacted with bad reviews.
- Source: LocaliQ on Online Review Stats
- Google’s Market Share in Search Engines
- Google holds 92% of the total worldwide search engine market share.
- Source: StatCounter Global Stats
- Consumer Shopping Behavior
- 45% of shoppers buy online and then pick up in-store.
- Source: Search Engine Journal
- Businesses Reporting on Marketing Campaign Influence
- Three-quarters of businesses report on how their digital marketing campaigns directly influence overall revenue.
- Source: HubSpot Marketing Studies
- Use of Marketing Attribution Reporting
- 52% of businesses use marketing attribution reporting.
- Source: HubSpot Marketing Statistics
- CRM Software Usage for Reporting
- 62% of marketers use CRM software for reporting.
- Source: HubSpot Marketing Statistics
Success Rate of Digital Marketing
These statistics provide a comprehensive view of the effectiveness and success rate of various digital marketing strategies, especially in terms of ROI and consumer behavior in response to advertising efforts.

- Impact of Display Ads on Brand Searches
- Consumers are 155% more likely to look up brand-specific terms after being exposed to display ads.
- Source: TechJury on PPC reports
- Effectiveness of Retargeting Ads
- Customers are 70% more likely to make a purchase from a retargeting ad.
- Source: Wordstream on Retargeting Campaign Tips
- ROI from PPC Advertising
- PPC returns $2 for every $1 spent, resulting in a 200% ROI.
- Source: SmallBizGenius on PPC Stats
- Conversion Likelihood from Display Ads
- There is a 59% likelihood of conversion when someone conducts a search after initially seeing a related display ad.
- Source: LocaliQ on Search vs. Display Ads
- Impact of Display Ads on Search Activity
- User’s search activity rises 155% after being served a display ad.
- Consumer Searches Following Display Ads
- 27% of consumers conduct a search for a business after seeing their display ad.
- Comparison of PPC and SEO in Generating Website Visitors
- PPC generates double the number of website visitors compared to SEO.
- Source: TechJury on PPC Stats
- Highest ROI Paid Ad Channels
- Paid ad channels with the highest reported ROI are Facebook Ads and Google Ads.
- Source: HubSpot Marketing Studies
Marketing Budget Allocation
These cool statistics provide insights into the allocation of marketing budgets between digital and offline channels and highlight the significant portion of digital advertising spent on social media.
- Distribution of Advertising Spend in 2020
- 50% of advertising was online in 2020.
- Offline advertising spend totaled to $196 billion.
- Digital advertising reached $378 billion.
- Source: Marketing Charts, Statista on Online Advertising
- Growth Rate Comparison Between Digital and Offline Media
- The annual growth rate for digital media is higher than that of offline media.
- Percentage of Online Advertising Spent on Social Media (2022)
- Social media constitutes 33% of all digital ad spending in 2022.
- Source: Hootsuite Digital 2022 Global Overview Report
AI in Digital Marketing
As we look towards the future, AI’s role in digital marketing is not just growing; it’s revolutionizing the field. In my early years in digital marketing, AI was a distant dream. Now, it’s a daily reality, personalizing user experiences, optimizing campaigns, and even creating content. The potential is limitless, and it’s exciting to think about where it will take us next.
Here are a list of most interesting AI in Digital Marketing Facts:
- AI Adoption Among Marketers
- 87% of marketers surveyed say that their use of AI is very advanced or advanced, utilizing AI for a range of activities including optimizing ad spend, analyzing conversations, A/B testing, and content generation. Source: Invoca’s State of AI in Digital Marketing Report
- Future Investment in AI
- Nearly 90% of marketers plan to allocate a specific budget for AI tools in 2024, with the majority planning to increase their investment compared to the current year. Source: Invoca’s State of AI in Digital Marketing Report
- Optimism Towards AI’s Future
- About 90% of marketers are optimistic about the future impact of AI in the industry. Source: Invoca’s State of AI in Digital Marketing Report
- Effectiveness of Generative AI in Email Marketing
- 95% of marketers using generative AI for email creation rate it as effective, with 54% finding it very effective. Source: HubSpot’s State of Generative AI Report, 2023
- AI and Marketing Automation
- 64% of marketers use AI/automation, and 38% of those not using it plan to start in 2024. Also, 47% of marketers use bots. Source: HubSpot Blog Marketing Strategy Report, 2024
- AI in Content Creation
- 50% of blog writers use AI to assist in content creation. Source: HubSpot Marketing Trends Report, 2024
Advanced AI Marketing Tools
Staying ahead in this fast-evolving landscape requires advanced tools. Salesforce’s AI-powered marketing platform, for instance, offers cutting-edge features for predictive analytics, customer journey mapping, and automated personalization. It’s a glimpse into the future of digital marketing, where AI is not just an assistant but a strategic partner.
Now, I’m curious to know your thoughts on the future. What trends do you see shaping digital marketing beyond 2024? How are you preparing to adapt to these changes? Let’s share our predictions and prepare for the future together.
And I invite you, dear reader, to share your experiences. What digital marketing channel or fact has given you the best ROI in 2024?
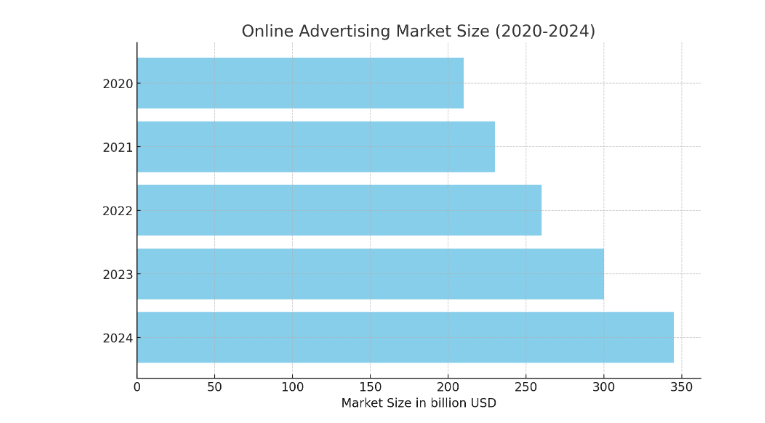
Online Advertising Statistics
In 2024, online advertising is not just an option; it’s a necessity. It’s like the smartphone of marketing tools – everyone’s using it, and for good reason. The effectiveness of online ads has skyrocketed, thanks to advancements in targeting and personalization technologies. We’re seeing ads that are so relevant, they almost feel like they’re reading your mind (in a non-creepy way, of course).
Speaking of size, the online advertising industry has grown to proportions that would make the early 2000s’ internet marketers’ heads spin. We’re talking about a multi-billion-dollar industry that has become the backbone of digital marketing strategies worldwide.
Now, let’s slice this cake a bit differently. When we look at the percentage of advertising spent online and on social media, the numbers are telling. An ever-increasing chunk of advertising budgets is being funneled into online channels, with social media platforms becoming gold mines for targeted advertising.
Given these trends, it’s no wonder that ad management tools are in high demand. A standout for me has been Hootsuite’s Advertising Platform. It simplifies managing and optimizing social media ad campaigns across different platforms. For digital marketers looking to get the most bang for their buck, this tool is a game-changer. And guess what? They offer a free trial, so you can test the waters before diving in.
Now Let’s explore the most interesting online advertising facts and statistics list:
Effectiveness of Online Advertising
These statistics provide a comprehensive overview of the effectiveness of various online advertising strategies and highlight the significant role of digital platforms in modern marketing.
- Annual Spend on Social Media Advertising (2022)
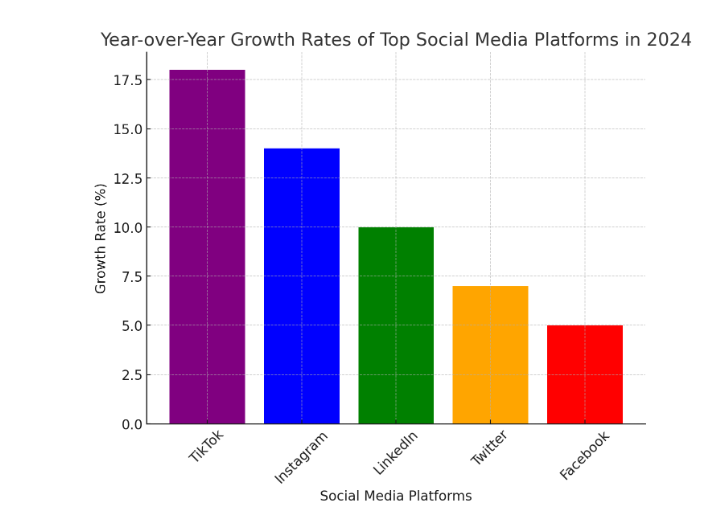
- Annual advertising spend on social media is $134 billion in 2022, a 17% year-over-year increase.
- Source: Hootsuite Digital 2022 Global Overview Report
- Website Traffic from Paid Search and Social
- 15% of the average business’s website traffic comes from paid search.
- Paid social traffic accounts for only 5% of overall website traffic.
- Source: Search Engine Journal
- Digital Marketers’ Plans for Paid Social Spend (2022)
- 4% of digital marketers are planning to increase their paid social spend in 2022.
- Source: Hootsuite Social Trends
- PPC Campaign Adoption
- 65% of small to mid-sized businesses have a PPC campaign.
- Source: WebFX PPC Statistics
- Small Businesses’ Use of Paid Search and Display Ads
- 45% of small businesses have a paid search strategy in place.
- 55% of small businesses use display ads.
- Source: LocaliQ on Search vs. Display Ads
- Google’s Revenue from Google Ads
- 96% of Google’s revenue comes from Google Ads.
- Source: TechJury on PPC Stats
- Industry Benchmarks for Google Ads
- Average click-through rate across all industries: 18%.
- Average cost per click across all industries: $3.53.
- Average cost per acquisition across all industries: $41.40.
- Average conversion rate across all industries: 82%.
- Source: Wordstream on Search Advertising Benchmarks
Online Advertising Industry Size
These statistics provide an understanding of the scale and challenges within the online advertising industry, including the substantial costs of ad fraud and the relatively low utilization of A/B testing for landing pages.
- Digital Ad Fraud Costs in the U.S.
- Digital ad fraud cost U.S. advertisers $15.9 billion in the past year.
- Source: Statista on Digital Ad Fraud Cost
- Use of Landing Page A/B Testing by Marketers
- Less than 20% of marketers use landing page A/B tests to improve conversion rates.
- Source: HubSpot Marketing Statistics
- Public Response to Paid Digital Ads
- Approximately 70% to 80% of people completely ignore paid digital ads.
- Source: SmallBizGenius on SEO Statistics
Advertising Spend Distribution
These statistics provide insights into how businesses allocate their advertising budgets, highlighting the significant role of SEO in driving website traffic and the varying levels of investment in SEO based on company size.
- Traffic Increase from Business Blogging
- Businesses that blog get 55% more traffic to their websites.
- Source: HubSpot on Business Blogging
- SEO’s Impact on ROI
- SEO leads have nearly a 15% close rate.
- 49% of businesses say that organic search brings them the best marketing ROI.
- Source: Ahrefs SEO Statistics, Backlinko SEO Stats
- SEO Spending by Company Size
- Big companies can spend between $10,000 – $20,000 per month on SEO, depending on their strategy.
- Small to medium-sized companies typically spend between $5,000-$10,000 per month on SEO.
- Source: RS Web Solutions on SEO Spending
Seo Advertising
These cool statistics provide insights into the spending habits of small and local businesses on SEO, user behavior on Google SERP, the importance of optimizing for voice search, and the search frequency of keywords.
- SEO Spending by Small and Local Businesses
- Small and local businesses spend between $1,000 and $5,000 per month on SEO.
- Source: Not specified in the document.
- Google Search Engine Results Page (SERP) Behavior
- Only 25% of people go to page two on Google, meaning 75% of people never scroll past the first page of the SERP.
- Source: Inter Growth on SEO Stats
- Organic Search Click-Through Rate (CTR)
- The top-ranking site in Google organic search results has an average CTR of 31%.
- A good average organic CTR is between 3-5%.
- Source: Ahrefs SEO Statistics, Databox on Improving Organic CTR
- Voice Search Result Length
- The average voice search result is only 29 words in length.
- Source: Ahrefs SEO Statistics
- Local Searches on Google
- 46% of all Google searches are for a local product or service.
- Source: Backlinko SEO Stats
- Keyword Search Frequency
- Approximately 92% of keywords get ten monthly searches or fewer.
- Source: Ahrefs SEO Statistics
PPC and Display Advertising
These statistics provide a deeper understanding of the intricacies of SEO and the impact of content marketing, highlighting the importance of website optimization and the role of Google Analytics in SEO strategies.
- Local SEO Impact on Purchase Decisions
- 28% of local searches result in a purchase within 24 hours.
- Source: Inter Growth on SEO Stats
- Google’s Algorithm Factors
- There are over 200 factors that Google’s algorithm considers when ranking a website.
- Source: Backlinko SEO Stats
- H1 Tag Usage in Small Business Websites
- A quarter of small business websites don’t have an H1 tag.
- Source: Backlinko SEO Stats
- Blogging and Content Marketing Statistics
- Brands that blog have 434% more indexed pages than those that don’t, highlighting the importance of content marketing.
- Source: SmallBizGenius on SEO Statistics
- No-Click Searches on Google
- Half of all browser-based searches on Google end with no clicks.
- Source: Search Engine Journal on SEO Statistics
- Google Analytics Usage
- Google Analytics is the most heavily used SEO tool currently.
- Source: HubSpot Marketing Statistics
Which social media platform has been your go-to for advertising in 2024, and why? Share your stories; let’s learn from each other’s successes and oopsies.
Search Engine Optimization (SEO) Statistics
Remember when SEO was just about stuffing keywords and hoping for the best? Those days are long gone. In 2024, SEO is an intricate art and a critical component of marketing online. It’s like a well-oiled machine, driving traffic, generating leads, and building brand authority. The SEO industry’s worth has skyrocketed, mirroring the increasing sophistication of search algorithms.
In this year, SEO’s relevance remains unchallenged. It’s all about delivering the right content to the right audience at the right time. From small businesses to colossal corporations, everyone’s in on the SEO game, vying for that coveted top spot in search engine results pages (SERPs).
Investing in SEO is not just a smart move; it’s essential for survival in the digital jungle. Companies are allocating significant portions of their marketing budgets to digital SEO, recognizing its unparalleled ROI. A dollar spent on SEO isn’t just an expense; it’s an investment in long-term digital success.
Let’s talk user behavior. Did you know that a staggering percentage of users never venture past the first page of Google? The second page is like the Bermuda Triangle – rarely explored. That’s why ranking on the first page is so crucial.
To stay ahead in the SEO race, tools like Moz Pro have become indispensable. Moz Pro offers an all-in-one suite of SEO tools that help businesses understand and improve their search visibility. It’s like having an SEO guru at your fingertips. Plus, they offer a free trial, perfect for those dipping their toes into the complex world of SEO.
Now Let’s explore the most interesting Search Engine Optimization (SEO) interesting statistics and facts list:
Search Engine Optimization Market Value
These statistics provide a clear view of the significant growth and value of the SEO market, highlighting its increasing importance in the digital marketing landscape.
Current and Projected SEO Market Value
-
- In 2020, the SEO industry was worth $80 billion.
- In 2019, the SEO industry was worth $43 billion and is projected to reach $86 billion in 2023.
- Source: The Guerrilla Agency on SEO Industry Forecast, The Business Research Company on SEO Market
Traffic Generation through SEO
These statistics provide insights into the importance of SEO in driving website traffic and the behavior of users in relation to search engine results pages.
- Percentage of Website Traffic from Organic Searches
- 53% of all website traffic comes from organic searches.
- Source: SmallBizGenius on SEO Statistics
- Traffic Boost from Business Blogging
- Businesses that blog get 55% more traffic to their websites.
- Source: HubSpot on Business Blogging
- Average Yearly SEO Spending by Businesses
- $5,000 is the average yearly amount businesses spend on SEO.
- Source: Search Engine Journal on SEO Statistics
- Online Experiences Starting with Search Engines
- 68% of all online experiences start with a search engine.
- Source: Inter-Growth on SEO Stats
- User Behavior on Search Engine Results Pages
- 75% of users don’t click past the first page of results.
- Source: WebFX on SEO Statistics
SEO Relevance and ROI
These statistics highlight the ongoing importance of SEO in solid digital marketing tactics and its significant impact on return on investment for businesses.
- Relevance of SEO in 2024
- 61% of marketers say that generating traffic and leads is their number one top marketing challenge, indicating the continued relevance of SEO.
- Source: Fundera on Small Business Marketing Statistics
- SEO Impact on ROI
- SEO leads have nearly a 15% close rate.
- 49% of businesses state that organic search brings them the best marketing ROI.
- Source: Ahrefs SEO Statistics, Backlinko on SEO Stats
Search Engine Optimization Spending
These statistics provide a comprehensive view of the spending patterns on SEO across businesses of various sizes, indicating the financial commitment that companies are making towards optimizing their online digital presence.
- Average Yearly SEO Spending by Businesses
- The average yearly amount businesses spend on SEO is $5,000.
- Source: Search Engine Journal
- SEO Spending by Big Companies
- Big companies can spend anywhere from $10,000 to $20,000 on SEO per month, depending on their strategy.
- Source: RS Web Solutions on SEO Tutorials
- SEO Spending by Small to Medium-Sized Companies
- Small to medium-sized companies can spend anywhere from $5,000 to $10,000 per month on SEO.
- Source: RS Web Solutions on SEO Tutorials
- SEO Spending by Small and Local Businesses
- Small and local businesses spend $1,000 to $5,000 per month on SEO.
- Source: RS Web Solutions on SEO Tutorials
Search Engine User Behavior
These statistics provide insights into user behavior on various search engines, highlighting the dominance of mobile searches and the importance of mobile optimization in SEO strategies.
- Origin of Google Searches
- 60% of Google searches originate from mobile devices.
- Source: Google Search Stats 2019
- Traffic Increase for DuckDuckGo
- DuckDuckGo, a privacy-centered search engine, saw a 107% increase in traffic between October 2019 and October 2021.
- Source: DuckDuckGo Traffic
- Monthly Search Volume for Bing
- Bing processes 12 billion searches every month.
- 38% of US-based Bing users have a household income of more than $100,000.
- Source: Statista on Bing, Statista on Bing Audience Share by Income
- Mobile Optimization Effectiveness
- 64% of SEO marketers call mobile optimization an effective investment.
- 54% of consumers use their phones over any other device when looking up a question on a search engine.
- Source: HubSpot Blog Research, HubSpot Blog Web Traffic & Analytics Report
Now, I’d love to hear from you. How has SEO impacted your business in 2024? Have you noticed a change in user behavior regarding search engine usage? Let’s discuss and share insights.
Social Media Marketing Statistics
In 2024, social media isn’t just a part of our daily lives; it’s a digital universe in its own right. From humble beginnings, it has grown into a market that is both vast and diverse. Just think about it: a decade ago, we were marveling at the possibility of reaching thousands. Today, we’re engaging with billions.
Estimated Value of the Social Media Market
-
- The social media market size is estimated to be worth $72.2 billion.
- Source: IBISWorld on Social Networking Sites Market Size
Social Media Marketing Budget
- On average, businesses allocate 9% of their marketing budget towards social media.
- Source: Statista on Social Media Marketing Budget Share
This statistic provides a clear insight into the substantial market value of the social media industry, indicating its significant impact and growth in the digital marketing sphere.
Social Media Marketing in Business Use
Businesses have embraced social media not just as a marketing tool, but as a vital communication channel. It’s where brands become friends with their customers, where storytelling turns into customer engagement. The leap from text posts to immersive AR experiences shows just how far we’ve come.
These social media marketing facts provide a comprehensive view of its landscape, including market size, budget allocation, business usage, and the competitive nature of the industry.
- Average Marketing Budget Allocation for Social Media
- On average, businesses allocate 9% of their marketing budget towards social media.
- Source: Statista on Marketing Budget Allocation
- Percentage of Businesses Using Social Media for Marketing
- Over 91% of businesses use social media for marketing.
- Source: Statistics on Social Media Usage in Marketing
- Competitiveness of the Social Media Industry
- 93% of businesses are active on Facebook, with 86% also utilizing Facebook advertising.
- Source: LocaliQ on Social Media Stats
Facebook Statistics and Facts
These statistics highlight the significant role and impact of Facebook in the social media landscape, emphasizing its vast user base, social media popularity among marketers, and the competitive nature of the platform in the industry.
1. Estimated Market Size of Social Media
- Facebook’s Global User Base: Facebook has approximately 3.049 billion users worldwide.
2. Average Marketing Budget Allocation for Social Media
- Facebook’s Popularity Among Marketers: Facebook is the most popular platform among marketers.
3. Percentage of Businesses Using Social Media for Marketing
- Usage by Marketers: 93% of marketers use Facebook to promote their business.
4. Competitiveness of the Social Media Industry
- Facebook’s Daily Active Users: Facebook has 1.91 billion users that are active daily.
- Source: Zephoria, 2021 on Facebook Statistics
- Engagement Rate Across Industries on Facebook: The median engagement rate is 0.08%.
- Source: Rivaliq, 2021 on Social Media Benchmarks
These statistics highlight the significant role and impact of Facebook in the social media landscape, emphasizing its vast user base, popularity among marketers, and the competitive nature of the platform in the industry.
Instagram Statistics and Facts
These statistics provide insight into Instagram’s role as a powerful digital marketing tool for marketing and customer engagement, with a particular emphasis on its high engagement rates and effectiveness in advertising.
- Instagram and Facebook ROI: Instagram and Facebook are tied for first place in terms of social platforms with the highest ROI.
- Instagram User Actions: 75% of Instagram users take action after seeing an ad.
- Marketer Usage: 77% of marketers use Instagram to promote their business.
- Business Accounts on Instagram: There are more than 200 million business accounts on Instagram.
- Instagram’s Active Daily Users: Instagram currently has 500+ million active daily users.
- Source: Instagram, 2021
- Instagram’s Future User Projections: Statista forecasts that Instagram will reach 1.4 billion users in 2025.
- Source: Statista, 2023
- Engagement Rates Comparison: Engagement rates on Instagram are approximately 6x higher than those on Facebook.
- Marketers’ ROI Perception: Marketers claimed they had the highest ROI from Facebook among all the social media platforms they advertised.
- Source: HubSpot
- Instagram’s Engagement Compared to Other Platforms: Instagram has 84x more engagement than Twitter and 10x more than Facebook.
- Source: Ignite Visibility, 2018
- Average Order Value from Instagram Followers: On average, Instagram followers are worth an order value of $65, compared to $55 on Facebook.
- Source: Ignite Visibility
- Instagram’s Monthly Active Users: There are over 1 billion users on Instagram that are active monthly.
- Source: Omnicore, 2021
- Instagram’s Advantage in Business Following: 90% of Instagram users follow at least one business on the platform.
TikTok’s User Engagement and Marketing Statistics and Facts
These statistics demonstrate TikTok’s rapidly growing influence in the social media landscape, its significant impact on user engagement and product marketing, and its increasing importance in the marketing strategies of businesses.
- User Perception of TikTok Ads: 72% of TikTok users find TikTok ads “inspiring,” and 70% of users said that TikTok ads were even enjoyable.
- Product Research and Purchase Influence: 25% of people on TikTok have researched or purchased a product after seeing a TikTok about it.
- Source: TikTok Business Blog
- User Engagement Rate: TikTok users engage 15% more often than users on other social media platforms.
- User Growth Prediction: TikTok is expected to surpass 5 billion users in 2022.
- Source: Social Media Today
- Business Adoption of TikTok: 40% of businesses plan to incorporate TikTok into their 2023 social media strategy.
- Marketer Usage of TikTok: 42% of marketers already use TikTok, and 56% plan to increase their investment.
- Source: HubSpot State of Marketing, 2023
- Download Statistics: TikTok is the most downloaded non-gaming app in the world with over 627 million downloads.
- Source: Business of Apps, 2023
- TikTok’s Growth Rate: The growth rate experienced by TikTok over the past 2 years is 105%, making it the fastest-growing social media platform.
- Increasing Marketing Budgets for TikTok: 56% of all marketers are planning to increase their TikTok budget.
LinkedIn’s Market Presence and User Engagement Facts
These statistics demonstrate LinkedIn’s significant role as a B2B platform, its influence in driving business decisions and content marketing, and its trustworthiness among consumers and marketers.
- Marketer Usage: 37% of marketers use LinkedIn.
- User Base: LinkedIn has over 900 million users, with roughly a quarter of them being U.S. internet users.
- Source: Statista, 2021
- B2B Display Advertising: LinkedIn is the largest B2B display advertiser in the U.S. at 32.3%.
- Source: eMarketer, 2021
- Decision-Making Members: 4 of 5 LinkedIn members drive business decisions.
- Source: LinkedIn, 2021
- B2B Marketing Usage: Over 90% of B2B marketers use LinkedIn for organic social marketing.
- Source: Foundation Inc., 2019
- Content Quality Perception: 91% of marketing executives list LinkedIn as the top place to find quality content.
- Source: Foundation Inc, 2019
- Mobile Traffic: 57% of traffic on LinkedIn is mobile.
- Source: Hootsuite, 2020
- Social Traffic to B2B Sites: LinkedIn drives more than half of all social traffic to B2B websites and blogs.
- Source: Foundation Inc, 2019
- Employee Engagement: 30% of a business’s engagement on LinkedIn comes from its employees.
- Source: LinkedIn Company Pages, 2020
- Content Publication: Over 1 million LinkedIn members publish content weekly.
- Source: Omnicore, 2022
- User Time Investment: The typical LinkedIn user only spends 17 minutes per month on the platform.
- Source: Ignite Visibility, 2021
- Influencers and Decision-Makers: 61 million LinkedIn users are senior-level influencers and 40 million are in decision-making positions.
- Source: Foundation Inc
- Trust Among US Consumers: LinkedIn is the most trusted social media platform by US consumers.
- Source: LocaliQ
- LinkedIn for B2B Businesses: 80% of B2B businesses use LinkedIn Advertising, and 96% of B2B content marketers use LinkedIn for organic social media marketing.
- Companies on LinkedIn: Currently, there are 55 million companies on LinkedIn.
- Sales Reps Performance with LinkedIn Connections: 98% of sales reps with 5000+ LinkedIn connections meet or surpass sales quotas.
- Source: The Sales Benchmark Index
Snapchat’s User Engagement and Advertising Stats
These statistics highlight Snapchat’s strong presence among U.S. teens, its significant daily usage, and its impact as a platform for advertising and impulsive purchase behavior.
- Daily Check by U.S. Users: 59% of U.S. users check Snapchat daily.
- Source: Pew Research Center, 2021
- Daily Time Spent on Platform: Snapchat users spend over 30 minutes a day on the platform.
- Source: Snapchat, 2021
- Global User Base: There are over 300 million people who use Snapchat.
- Source: Snapchat, 2021
- Revenue from North America: Of Snapchat’s $1.79 billion global revenue in 2019, $1.07 billion came from North America.
- Source: Statista, 2020
- Popularity Among U.S. Teens: In 2019, Snapchat was the most important social network for 44% of U.S. teens.
- Source: Statista, 2020
- Daily Active Users: 265 million daily active Snapchat users open the app more than 30 times per day.
- Purchase Behavior: Snapchat users are more likely to buy products or services from their mobile device and are 60% more likely to make impulse purchases.
- Source: ForBusiness Snapchat on Shopping Behaviors
- Business Presence: 30 million businesses are viewable on Snapchat.
- Source: Snapchat, 2022
- Advertisement Formats: Snapchat offers six different advertisement formats on the platform.
- Source: Snapchat, 2022
- Usage by Video Marketers: Only 9% of video marketers used Snapchat as a video channel in 2023.
- Source: LocaliQ on Video Analytics
- Advertising Cost: The average cost per swipe for Snapchat ads is between $0.30 and $1.00.
Twitter Statistics
These statistics highlight the impact of Twitter on brand preference and perception, as well as its position in terms of ROI for advertising in the United States.
- Brand Preference Improvement Using Twitter
- On average, brands that use Twitter for business experience a 7% improvement in brand preference.
- Source: Twitter for Business
- Positive Brand Perception After Tweet Replies
- 77% of Twitter users feel more positive about a brand after their Tweet has been replied to.
- Source: Brandwatch
- Twitter’s Ranking as ROI Driver for Ad Buyers
- Twitter is the lowest-ranking ROI driver for ad buyers in the United States.
- Source: eMarketer
Pinterest Statistics
- Marketing Strategy Inclusion
- 21% of marketers leverage Pinterest in their marketing strategy. Source: HubSpot Blog Marketing Trends Report 2024
- Global Active Users
- Pinterest has 482 million global active users every month. Source: Pinterest, 2023
- Audience Demographics
- Women make up more than 70% of Pinterest’s global audience. Source: Statista, 2023
- Search Behavior
- 97% of top searches on Pinterest are unbranded. Source: Pinterest, 2023
- Platform Usage
- Most Pinterest users use the platform to plan new projects. Source: Pinterest, 2021
- User Engagement and Purchase Behavior
- 95% of Pinterest users have the app to help them plan or make a purchase.
- 52% of Pinterest users have seen something on the app and made the purchase online later. Source: Pinterest Blog on How Pinterest Drives Purchases Online and Off; Social Media Today on Pinterest Users’ Purchase Behavior
- Demographic Growth
- Pinterest’s demographics have expanded with male and Gen Z users growing 40% year over year. Source: Pinterest, 2020
- Shopping Cart Size
- Pinterest users have 85% larger shopping carts than buyers on other platforms. Source: SproutSocial
Youtube Statistics
- Global Website Ranking
- YouTube is the second most visited website in the world. Source: HubSpot Blog Research, 2021
- Video Marketers’ Preference
- 88% of video marketers planned to use YouTube in 2020. Source: Wyzowl, 2020
- User Base
- Over 2 billion users navigate the YouTube platform. Source: Omnicore
- Demographic Reach
- On mobile alone, YouTube reaches more people in the 18-34 U.S. audience demographic than any TV network.
- 49% of U.S. users are over the age of 65. Source: YouTube, 2020
- Video Consumption
- One billion hours of videos are watched per day on YouTube. Source: YouTube, 2021
- Popularity Ranking
- YouTube is the second most popular site worldwide, after Google. Source: Alexa, 2022
- Daily Usage
- The average time spent on YouTube daily is 18 minutes. Source: Omnicore
- Consumer Behavior
- 70% of consumers have purchased a product after seeing it advertised on YouTube. Source: Google Ads and Commerce Blog
- Global Video Preference
- YouTube is the preferred source of video for 83% of consumers globally.
- Over 88.9% of watch time on YouTube is done from mobile devices. Source: HubSpot, 2019; Viralyft, 2023
- Marketing Platform Usage
- YouTube is the most widely used platform among video marketers. Source: Wyzowl
- Brand Consideration and Awareness
- Companies like Purple and Schmidt Naturals saw significant boosts in brand consideration and awareness through Google Ads audience targeting on YouTube. Source: Google, 2020
- Viewer Preference and Purchase Influence
- Viewers are 4x more likely to use YouTube versus other platforms to find information about a brand, product, or service.
- Viewers are 2x more likely to buy something they saw on YouTube. Source: Google, 2020
- Marketing Budget Plans
- Almost half of all marketers are planning to increase their YouTube budget. Source: HubSpot Blog Marketing Trends Report, 2024
- Advertising Effectiveness
- YouTube mobile ads are 84% more likely to hold attention than TV ads. Source: Statusbrew
Social Media Management Tools
Each platform has its own flavor, its own audience. Facebook, with its broad reach, remains a staple. Instagram, the king of visual storytelling, continues to captivate. Newer platforms like TikTok have exploded in popularity, offering fresh, dynamic ways to engage with audiences.
Managing this ever-expanding social media universe requires the right tools. Buffer, for instance, stands out with its user-friendly interface and powerful features. It simplifies scheduling, posting, and analyzing content across multiple platforms. And they offer a free trial, making it easier for businesses to find their social media footing.

Now, over to you: Which social media platform has been your go-to in 2024, and how has it impacted your business?
Email Marketing Statistics
Email marketing, the venerable old-timer of the digital marketing world, still packs a punch in 2024. Its ability to connect directly with consumers, bypassing the noise and clutter of social media, keeps it at the top of the marketing mix. The industry’s value has grown consistently, defying skeptics who thought it would fade away.
What’s fascinating in 2024 is not just the quantity of marketing emails, but their effectiveness. With advanced segmentation and personalization, marketing emails have become more targeted, more relevant, and thus, more effective. The percentage of emails leading to conversions has seen a noteworthy increase.
The ROI of email marketing remains one of the highest across all digital channels. It’s like the Swiss Army knife of digital marketing – versatile, reliable, and cost-effective. For every dollar spent, businesses are seeing significant returns, making it a staple in their marketing arsenals.
 3D area chart with a illustrating the Compound Annual Growth Rate (CAGR) of email marketing from 2020 to 2026.
Now Let’s explore the email marketing facts and stats list:
Email Marketing Market Value and Growth
These statistics demonstrate the substantial growth and value of the email marketing industry, underlining its importance and potential in the digital marketing landscape.
- Current and Projected Value of Email Marketing Industry
- The email marketing industry is currently worth $9.62 billion and is projected to grow to $17.9 billion by 2027.
- Source: Statista on Email Marketing Revenue Worldwide
- Growth in Number of Global Email Users
- The number of global email users is projected to grow to 4.8 billion users by 2024.
- Source: HubSpot Marketing Statistics
- Global Email Users
- 4 billion people use email every day. This figure is anticipated to increase to 4.6 billion by 2025.
- Source: Statista on Number of E-mail Users Worldwide
- Email Usage Among Small Firms
- Email marketing is used by small firms to contact clients in 64% of cases.
- Source: Simplilearn on Email Marketing Tools
Email Marketing Success Rates
These statistics provide insights into the effectiveness and success rates of email marketing, demonstrating its significant ROI and engagement metrics.
- Average Email Clickthrough Rate
- The average email clickthrough rate is 2.6-3%.
- Source: HubSpot Blog Web Traffic & Analytics Report, 2023
- Average Open Rate and Click-Through Rate
- The average open rate across all industries is 80%, and the average click-through rate is 2.78%.
- Source: Marketing Insider Group
- Small Businesses and ROI from Email Marketing
- Small businesses claim that email marketing is the marketing channel that brings them the highest return on investment.
- Source: HubSpot Marketing Statistics
ROI of Email Marketing
These statistics provide insights into the effectiveness and profitability of email marketing, demonstrating its significant ROI and the importance of metrics like open rates and click-through rates in measuring success.
- Average ROI for Email Marketing
- The average ROI for email marketing is $36 for every $1 spent.
- Source: Constant Contact
- Email Marketing as a High ROI Channel for Small Businesses
- Small businesses claim that email marketing is the marketing channel that brings them the highest return on investment.
- Source: HubSpot Marketing Stats
- Open Rate and Click-Through Rate in Email Marketing
- The average open rate across all industries is 80%, and the average click-through rate is 2.78%.
- Source: Marketing Insider Group
- Leads as a Success Measure in Marketing Channels
- Over 20% of businesses say that the number of leads generated is the primary factor they base the success of their marketing channels.
- Source: Impression Marketing Census 2021
Email Marketing Trends
These statistics highlight various trends in email marketing, emphasizing the importance of relevant content, mobile optimization, and personalization in engaging recipients and achieving marketing success.
- Relevance of Content in Email Marketing
- 68% of people automatically delete emails that don’t have content relevant to their interests.
- Source: WebFX on Personalized Marketing
- Importance of Mobile Optimization in Emails
- 3% of people will delete an email if it’s not optimized for mobile.
- Source: OptinMonster on Email Marketing Stats list
- Average Click-Through Rate Across Industries
- The average email’s click-through rate across all industries is 26%.
- Source: Mailchimp on Email Marketing Benchmarks
- Use of Email Marketing by Marketers
- 90% of marketers use emails to distribute content organically.
- Source: Oberlo on Email Marketing Statistics
- Email Personalization Practices by Marketers
- 4 out of 5 marketers personalize emails with profile data, and 64% personalize them by segment.
- Source: Constant Contact, 2023, HubSpot Blog Research
- Criticality of Email Marketing for Business Success
- 87% of marketers say that email marketing is critical to business success.
- Source: Litmus, 2023
Email Automation Tools
In this realm, automation tools have become indispensable. Take, for example, HubSpot’s Email Marketing Tool. It offers a comprehensive suite for creating, personalizing, and optimizing email campaigns. It’s a powerful asset for any marketer looking to elevate their email marketing strategy. And they offer a free trial, a perfect opportunity to experience its capabilities firsthand.
I’m curious about your experiences. What email marketing strategies have worked wonders for you in 2024?
Website Optimization Facts and Statistics
Importance and Impact of Website Optimization
In 2024, website optimization is not just a best practice; it’s a vital necessity. Like a well-tuned engine in a high-performance car, a well-optimized website drives better engagement, higher conversion rates, and ultimately, more significant business success. In my early days, a slow-loading website was a nuisance. Today, it’s a business killer.
These statistics provide insights into the critical aspects of website optimization and its impact on user engagement and business credibility. They also highlight the expectations of consumers regarding website performance and the prevalence of website ownership among small businesses.
- Importance of Website Optimization
- About half a second is all it takes for visitors to form an opinion about a website.
- 38% of people will stop engaging with a website if the content or layout is unattractive.
- Three-quarters of consumers judge a company’s credibility based on its website design.
- Websites with superior user experience can generate a 400% higher conversion rate.
- Source: Sweor on First Impressions, HubSpot on Website Design Stats, Kinesis on Web Design, Forrester on User Experience
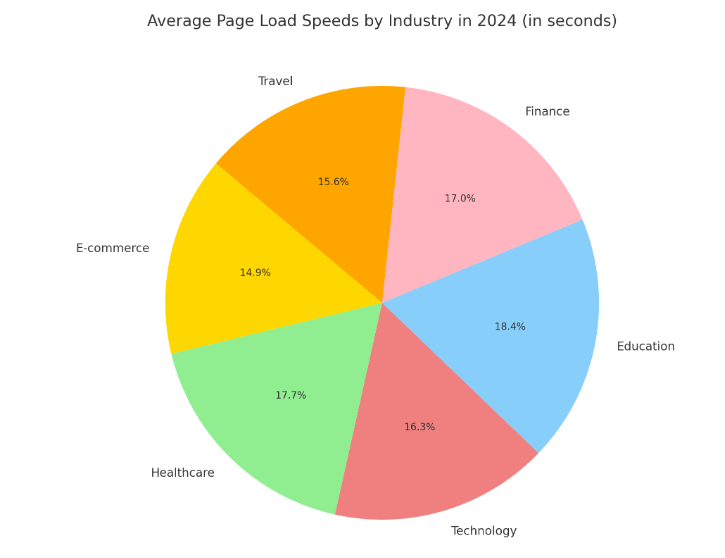
- Ideal Website Page Load Speed
- Nearly half of all consumers expect a website to load in a maximum of 2 seconds.
- Source: Sweor on First Impressions
- Percentage of Small Businesses with a Website
- 72% of small businesses have a website.
- Source: PR Newswire on Small Business Websites
- Percentage of Small Businesses with a Website
- 72% of small businesses have a website.
- Source: PR Newswire on Small Business Websites
Website Design and Credibility
These statistics highlight the critical importance of website design in forming first impressions, engaging visitors, and establishing a company’s credibility.
- Opinion Formation Based on Website Design
- It takes about half a second for visitors to form an opinion about your website.
- Source: Sweor on First Impressions
- Impact of Unattractive Content or Layout
- 38% of people will stop engaging with a website if the content or layout is unattractive.
- Source: HubSpot on Website Design Stats
- Judging Company Credibility by Website Design
- Three quarters of consumers say they judge a company’s credibility based on its website design.
- Source: Kinesis on Web Design
Website Page Load Speed and Business Website Ownership
Speed is of the essence. The correlation between page load speed and user engagement is stronger than ever. Websites that load in the blink of an eye see higher retention rates and improved user experiences. Conversely, even a one-second delay can lead to substantial losses in conversions.
These statistics highlight the critical importance of fast website loading times for maintaining user engagement and the impact of security on user trust and retention.
- Consumer Expectations for Website Load Time
- Nearly half of all consumers expect a maximum loading time of 2 seconds for the average website.
- Source: Sweor on First Impressions
- Impact of Load Times on Bounce Rates
- Load times longer than 2 seconds will increase bounce rates by 50%.
- About half of the websites that rank high on the SERP (Search Engine Results Page) are HTTPS.
- 85% of people will abandon a page if they realize it’s an unsecured website, even if they already have a purchase in process.
- 43% of small businesses that have a website plan on improving their website performance this year.
- Source: Omnicore Digital Marketing Statistics, PR Newswire on Small Business Websites
Mobile Website Traffic and User Engagement Impact
The mobile revolution continues unabated in 2024. More users are accessing websites via mobile devices, making mobile optimization a critical aspect of website design. Sites that offer seamless mobile experiences see higher user engagement and loyalty. Here is a list of statistics related to Consumer Behavior and Mobile Traffic Impact:
- Smartphone Usage for Online Search: 93% of smartphone owners use their phone to search online.
- Source: Statista
- US Paid Search Impressions on Mobile: 70% of US paid search impressions and clicks occurred on mobile devices.
- Source: Kenshoo
- Smartphone Research Before In-Store Buying: 70% of smartphone owners use their device to conduct further research before buying in-store.
- Source: Think with Google
- Online Shopping Cart Abandonment Rate: 68.7% of individuals abandoned their shopping carts in the US.
- Source: Fresh Relevance
- Ecommerce Website Conversion by Device: On an average mobile device visit, 2.3% of Ecommerce website visits result in purchases, compared to 3.8% on desktop.
- Source: Statista
- Voice Technology for Shopping: 9% of people use voice technology to shop once a week or more frequently.
- Source: PwC Consumer Insights Survey
- Local Search to Store Visit: 88% of mobile users who search for a store on Google Maps visit a related store within a week, and 28% of “nearby” or “near me” searches end in a purchase.
- Source: Think with Google
- Brand Switching for Personalized Communication: 52% of consumers would switch brands if they were not getting custom messages and offerings.
- Source: V12 Data
- First Impression Timeframe: It takes about half a second for visitors to form an opinion about your website.
- Source: Sweor
- Impact of Unattractive Content or Layout: 38% of people will stop engaging with a website if the content or layout is unattractive.
- Source: HubSpot
- Judging Company Credibility by Website Design: Three-quarters of consumers judge a company’s credibility based on its website design.
- Source: Kinesis Inc
- Reasons for Leaving a Website: 73% of users leave a website due to non-responsive web design.
- Source: Elementor
- Consumer Expectation for Mobile Websites: 60% of people said they wouldn’t recommend a business if it had a poorly designed mobile website.
- Source: Social Publishing Community
- Impact of Poor Website Experience: Nearly 90% of consumers will shop with a competitor after a poor website experience.
- Source: WebFX
- Return on Investment in User Experience: Investing in your site’s user experience leads to a $100 return for every $1 you spend.
- Source: WebFX
Website Optimization Tools
For website optimization, tools like Google’s PageSpeed Insights have become indispensable. It provides comprehensive insights into website performance and practical recommendations for improvement. The tool has evolved to be more intuitive and user-friendly, catering to both seasoned webmasters and new website owners.
So, how have you optimized your website in 2024? What changes have you seen in user engagement and conversion rates?
Content Management and Blogging Statistics
Mobile Marketing, Visual Content, Video Marketing
2024 has seen the rise of more immersive and interactive digital marketing domains. Mobile marketing has become more sophisticated, with location-based services and AR experiences leading the way. Visual content and video marketing have evolved beyond mere storytelling tools; they are now essential for engagement and conversion.
Landing Pages, Blogging, and Other Strategies
Landing pages have become more than gateways; they are experiences. In my early years, a landing page was a simple call-to-action. Now, they are rich with multimedia, interactivity, and personalization. Similarly, blogging has transformed. It’s no longer just about sharing thoughts; it’s a strategic tool for SEO, thought leadership, and community building.
Here are a list of most interesting Blogging Statistics and Facts:
- Marketing Priority and Impact
- 53% of marketers consider blogging to be at the top of their content marketing agenda.
- Blogging drives 97% more links to business websites and 68% of consumers feel that a blog makes a website more trustworthy. Source: HubSpot State of Inbound 2018 Global Results; Hosting Tribunal on Blogging Statistics
- Blogging Presence
- As of 2023, there are over 1.9 billion websites globally, with more than 600 million of them being blogs. Source: WPDeveloper, 2023
- Effectiveness and Engagement
- 56% of marketers who leverage blogging say it’s effective, and 10% say it generates the biggest return on investment.
- 54% of decision-makers spend more than one hour per week reading and reviewing thought-leadership content. Source: HubSpot Blog Research, 2021; Edelman/LinkedIn 2021
- Popularity as a Distribution Channel
- 79% of marketers report a blog as the second most popular distribution channel.
- 40% of marketers think that a blog is one of the most effective marketing channels.
- 60% of people purchase a product after reading a blog post about it. Source: Content Marketing Institute, 2023
- Use of AI in Blogging
- 50% of blog writers use AI to assist them in content creation. Source: HubSpot Marketing Trends Report, 2024
- Blogging in Marketing Strategy
- 29% of marketers leverage blog posts as part of their content strategy.
- 33% of marketers use blogs as one of their top six marketing strategies. Source: HubSpot Blog Research
Content Management and Analytics Tools
In this dynamic landscape, tools like WordPress and Google Analytics have become more than just utilities; they’re integral to digital marketing success. WordPress’s flexibility in creating responsive websites and blogs is unparalleled, while these marketing Analytics and metrics provides the insights needed to fine-tune strategies for maximum impact.
Write in the comments, what tools or platforms have you found most effective? Let’s share and learn from each other’s journeys.
E-commerce, B2B and B2C Statistics
In 2024, digital marketing has tailored its cloak to fit each industry uniquely. In E-commerce, it’s all about customer experience and personalization – creating virtual shopping experiences that rival physical stores. For B2B, the focus has shifted to building long-term relationships and leveraging data-driven strategies. B2C companies, meanwhile, are harnessing the power of social media and content marketing to connect emotionally with customers.
Here are a list of most interesting Ecommerce Statistics and Facts:
E-commerce Statistics
- Voice Technology in Shopping
- 9% of people use voice technology to shop at least once a week. Source: PWC Consumer Insights Survey
- E-commerce Market Share
- E-commerce is expected to account for 5% of total global retail sales by 2021. Source: Statista on E-commerce Share of Retail Sales
- Traffic Sources for E-commerce Websites
- More than two-thirds of e-commerce website traffic comes from Google (43% organic, 26% CPC). Source: Wolfgang Digital E-commerce KPI Report
- Amazon’s Market Share
- Amazon accounted for 50% of all US E-commerce sales as of 2021. Source: Statista on Amazon Retail Market Share
- Mobile Commerce Adoption
- 51% of shoppers have completed an online purchase with a smartphone. Source: Pew Research Center on Mobile Commerce
B2B Marketing Statistics
- B2B Commerce Market Size
- B2B Commerce market in the US is expected to hit $1.2 trillion by 2021. Source: Accenture Report on B2B Digital Commerce
- Digital Advertising Spend
- B2B digital advertising spending in the U.S. is projected to reach $18.5 billion by 2024. Source: RebelMouse on Digital Marketing Statistics
- LinkedIn’s Role in B2B
- 80% of B2B businesses use LinkedIn Advertising, and 96% use LinkedIn for organic social media marketing. Source: LinkedIn Social Media Advertising Statistics
- ABM and Automation
- 92% of B2B marketers now have an Account-Based Marketing (ABM) program, with 68% using automation. Source: Salesforce on B2B Marketing
- Content Marketing in B2B
- 79% of marketers report a blog as the second most popular distribution channel in B2B. Source: Content Marketing Institute on B2B Content Marketing Trends
B2C Marketing Statistics
- Instagram’s Influence in B2C
- Instagram is significantly influencing purchases in B2C industries, especially those that are highly visual. Source: Louise Myers Visual Social Media
- Digital Marketing Budget Allocation
- 72% of overall marketing budgets are allocated towards digital marketing channels. Source: Web Strategies on Online Marketing Budgets
- Content Marketing Impact
- 86% of B2C marketers say content marketing is key to their strategy. Source: Content Marketing Institute B2C Research
E-commerce Optimization Tools
In this evolving market, e-commerce optimization tools have become crucial. Shopify, for instance, has revolutionized the way businesses set up online stores. Its ease of use, coupled with powerful analytics, makes it a top choice for businesses looking to thrive in the digital marketplace.
Regional Insights
Facts About Digital Marketing in the UK and US
The landscape of digital marketing in 2024 shows intriguing regional variations. In the UK, there’s a strong emphasis on data privacy and personalized content, reflecting the public’s growing awareness of data use. Meanwhile, in the US, there’s a surge in video marketing and influencer collaborations, tapping into the American love for visual storytelling and celebrity culture.
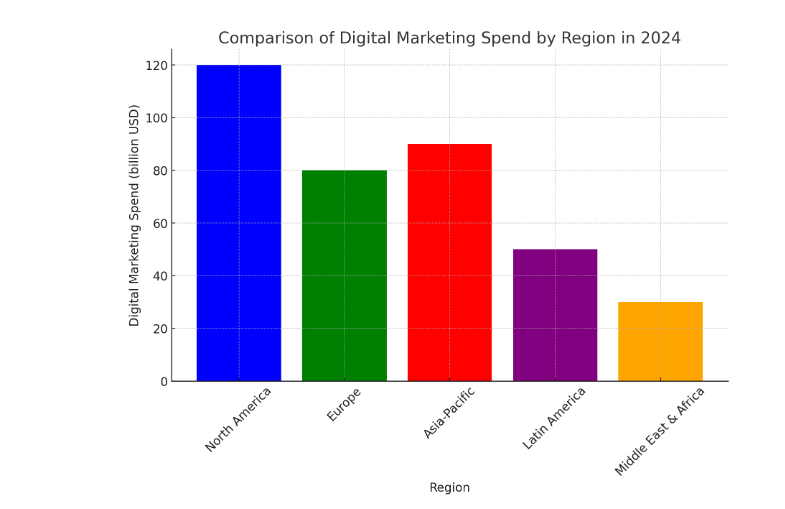
Regional Advertising Spend and Social Media Trends
Advertising spend in different regions mirrors cultural and economic trends. For instance, in the US, there’s a significant investment in social media and search engine advertising, reflecting the high digital engagement of the audience. In contrast, European markets are seeing a rise in sustainable and ethical marketing, aligning with the region’s strong focus on environmental and social responsibility.
Regional Marketing Analysis Tools
Understanding these regional nuances is crucial. Tools like SEMrush’s Market Explorer provide invaluable insights into regional market trends and consumer behaviors. For marketers aiming to tailor their strategies to specific geographies, such tools are indispensable.
Digital Marketing ROI and Effectiveness
Brand Awareness through Digital Ads
In 2024, digital ads have transcended beyond mere visibility. They’re now a powerful tool for building brand awareness in ways that resonate deeply with audiences. The creativity and personalization in digital ads have reached new heights, making them not just ads, but stories that capture hearts and minds.
Credibility and Trust Building through Digital Marketing
Digital marketing has become a key player in building credibility and trust. In an era of information overload, authenticity and transparency in marketing messages have never been more crucial. Brands that master this art are seeing a tangible increase in customer loyalty and trust.
Blogging Effectiveness and Other Tactical Insights
Blogging, a veteran tool in the digital marketing toolkit, continues to prove its worth. In 2024, it’s not just about providing content; it’s about offering value, insight, and engagement. Blogs that offer in-depth analysis, practical advice, or unique perspectives are driving significant traffic and conversions.
Advanced Marketing Analytics Tools
Understanding the ROI and effectiveness of digital marketing strategies is paramount. Tools like Adobe Analytics offer advanced insights into customer behavior, campaign performance, and more. They allow marketers to dissect data in ways that were once deemed impossible, providing a clear picture of what works and what doesn’t.
Now, write to us how have you measured the ROI of your digital marketing efforts in 2024? What strategies have been most effective for you in building brand trust and awareness? Share your experiences and let’s learn together.
Digital Marketing Job Market
Job Openings and Demand in Digital Marketing
The digital marketing job market in 2024 is a bustling hub of opportunity. With the industry’s expansion, demand for skilled digital marketers has soared. From SEO specialists to content creators, the range of roles is more diverse than ever. Companies are not just looking for marketers; they’re seeking digital storytellers, data wizards, and strategy maestros.
Marketing Skill Trends: Social Media, Management
The most sought-after skills in the digital marketing realm have evolved. Mastery in social media marketing, content management, and data analytics tops the list. But there’s also a growing emphasis on soft skills like creativity, adaptability, and strategic thinking – skills that robots can’t replicate… yet!
Freelancing in Digital Marketing
Freelancing in digital marketing has taken on a new dimension. It’s no longer just a side hustle; for many, it’s a full-fledged career path. With the rise of remote work culture, freelancers are enjoying more flexibility and a broader range of opportunities, both locally and globally.
Freelance Management Tools
For freelancers, managing multiple projects and clients can be daunting. That’s where tools like Trello and Asana come into play, helping to organize tasks, deadlines, and communications efficiently. They’re essential for anyone looking to thrive in the freelance digital marketing landscape.
Share with us in the comments: What’s your experience in the digital marketing job market this year? Have you noticed new trends in skills demand? Whether you’re a freelancer or a full-time professional, share your journey and insights.
Future Trends and Predictions

Omnichannel Personalization and First-Party Data Usage
Omnichannel personalization has become the gold standard in 2024. Brands are no longer just broadcasting messages; they’re engaging in conversations across multiple channels. The use of first-party data, with its high level of accuracy and relevance, is driving this trend, ensuring that customers receive a consistent and personalized experience regardless of the channel.
Evolving Digital Marketing Strategies
Digital marketing strategies are evolving at a breakneck pace. The focus has shifted from simply capturing attention to providing value and building relationships. Brands that succeed in 2024 are those that understand and adapt to these changes, leveraging technology and data to create meaningful connections with their audience.
Conclusion
Synthesis of Key Digital Marketing Statistics for 2024
As we wrap up our journey through the digital marketing landscape of 2024, let’s take a moment to reflect on what we’ve uncovered. From the explosive growth in online advertising to the nuanced shifts in SEO strategies, the evolution of social media, and the burgeoning importance of AI and omnichannel marketing, this year has been a testament to the dynamic and ever-changing nature of digital marketing.
In navigating this complex landscape, comprehensive solutions like HubSpot’s All-in-One Marketing Software become invaluable. Offering a suite of tools for everything from SEO to social media management and email marketing, it’s designed to streamline and enhance the digital marketing process. Embracing such tools is not just about simplifying tasks; it’s about enriching strategies and driving results.
Future Outlook and Strategic Recommendations
Looking ahead, the horizon of digital marketing is vast and full of potential. The key to success lies in agility and the willingness to embrace new technologies and trends. As digital marketers, our mission is not just to follow these trends but to anticipate and shape them. The future belongs to those who are prepared to innovate and adapt.
Final Thoughts
As we conclude, I invite you to view digital marketing not just as a set of strategies and tools but as an ongoing dialogue between brands and consumers, a dance of innovation and creativity. As someone who has navigated these waters for two decades, my parting advice is to stay curious, be adaptable, and always remember the power of a well-told story.
Thank you for joining me on this exploration of ‘Digital Marketing Statistics 2024’. I look forward to seeing how you’ll use these insights to craft your digital marketing narratives and strategies. Let’s continue to learn from each other and shape the future of digital marketing together.
Author
-

He is a standout expert in digital marketing with a solid 20 years under his belt, shining particularly in the world of SEO. He's known for his fresh, innovative approaches and deep knowledge of the industry. Alex has developed digital marketing strategies for a wide array of clients, making him a well-respected voice in the field. His unique mix of professional skill and engaging storytelling sets him apart.
Alex has been at the forefront of the digital revolution, shaping marketing strategies with creativity and data-driven insights. Alex's career is a clear reflection of his dedication to keeping up with the constantly changing digital landscape. Over the years, he has spearheaded numerous successful campaigns, led dynamic teams, and consistently delivered growth for a diverse range of clients. His expertise encompasses all facets of digital marketing, from SEO and content strategy to social media and analytics.
Areas of Expertise:
 Alex specializes in integrating comprehensive digital strategies, excelling particularly in SEO, content marketing, and data analytics. His approach involves a unique blend of creative storytelling and meticulous data analysis, ensuring every campaign is both engaging and effective.
Alex holds a Bachelor's degree in Marketing from the University of Pennsylvania and has completed several advanced certifications in digital marketing and analytics. Alex's passion for digital marketing ignited during his early college days, where he was fascinated by the potential of the internet to connect and influence people. This fascination turned into a lifelong career, fueled by a desire to explore new digital frontiers.
He has been Recognized as a thought leader in the industry, Alex has received numerous accolades for his innovative approaches and has been a keynote speaker at several prestigious digital marketing conferences worldwide. Alex has also been featured in podcasts and webinars, sharing his insights and experiences in the evolving digital landscape.
Outside the office, Alex is an avid traveler and photography enthusiast, always eager to capture the beauty of diverse cultures and landscapes.